
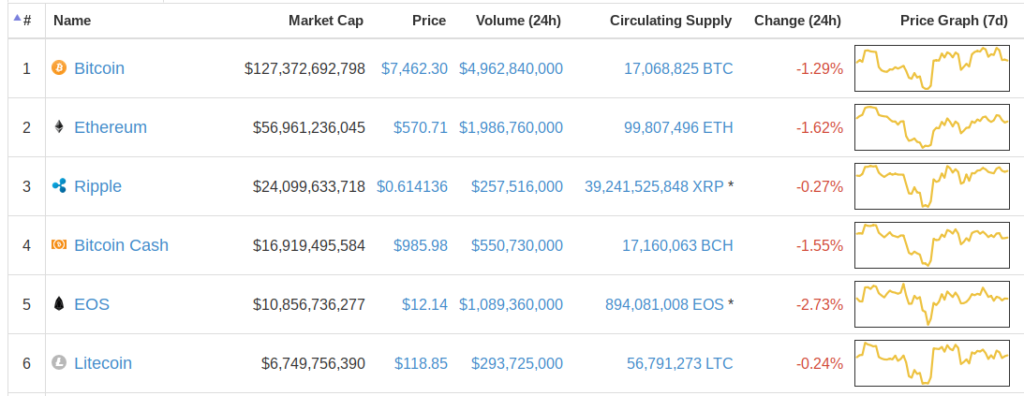
Today was bearish for cryptocurrencies, as stock markets were higher and the U.S. dollar saw mixed results against its major counterparts. Bitcoin is trading lower by 1.29%, making it a middle crypto performer on the day. EOS was today’s worst performer, with losses of 2.73%, while Ripple also traded lower on the session with losses of 0.27%.
Today’s Top Crypto Performances
The trend in cryptocurrencies remained lower on the day, moving in-line with the longer-term outlook for the asset class. Bitcoin underperformed some of the major cryptocurrencies today, and technical analysis readings suggest that this may continue tomorrow.
Short-term Chart View: Bitcoin / U.S. Dollar
Support Level: 7330
Resistance Level: 7600
BTC Short-term Price Direction: Sideways
On the short-term time frames, Bitcoin is showing sideways readings. Against the U.S. dollar, the price of Bitcoin has moved little over the last 24 hours. Market prices are now trading at 7517 against the USD. Bitcoin is trading at the middle of its recent trading range, and the technical indicator readings have turned neutral at 50. The RSI indicator is falling, which indicates a decline in momentum. If we see a break of the uptrend line on the 30-minute charts, traders will likely consider moving into new short positions in BTC.
Long-term Chart View: Bitcoin / U.S. Dollar
Support Level: 7090
Resistance Level: 7930
BTC Long-term Price Direction: Down

On the long-term time frames, the picture is much more bearish. Bitcoin has been caught in a downtrend since May 4, 2018. Bitcoin is trading at the lower end of its long-term trading range, and this suggests that contrarian crypto traders might take advantage of these lower levels to buy the cryptocurrency and try pushing prices higher. Long-term, the technical indicator readings have turned neutral. The RSI indicator is trading near the midpoint at 50, which indicates stalling momentum. On the other hand, if we see a break of the downtrend line on the 4-hour charts, traders will likely consider moving into new long positions in BTC.
Bitcoin Trader’s Outlook
The recent market activity in Bitcoin suggests a mixed outlook for the market-leading cryptocurrency. Short-term indicators are neutral, and a loss of trendline resistance could force a retest of the previous highs near 7600. Long-term indicators are more bearish, and a break of the prevailing downtrend line could inspire bullish trading activity for Bitcoin traders interested in taking long-term positions.